Article
UX trends 2024: Five UXIs look into the crystal ball

- By
- Tobias Schlei
- Reading time
- 10 minutes
- Updated
As we look ahead to 2024, we see a UX landscape shaped by economic, social, and, not least, profound technological changes. This makes it all the more interesting to consider where the journey might take us this year, which topics will be important in and around the field of UX, and what developments we should prepare for. I asked our team which trends they consider relevant from their respective professional perspectives. The results are exciting and diverse. We hope you enjoy reading this and wish you a vibrant and successful 2024.
UX delivers on its promise
Trend by Rainer Sax, senior consultant, strategy & UX
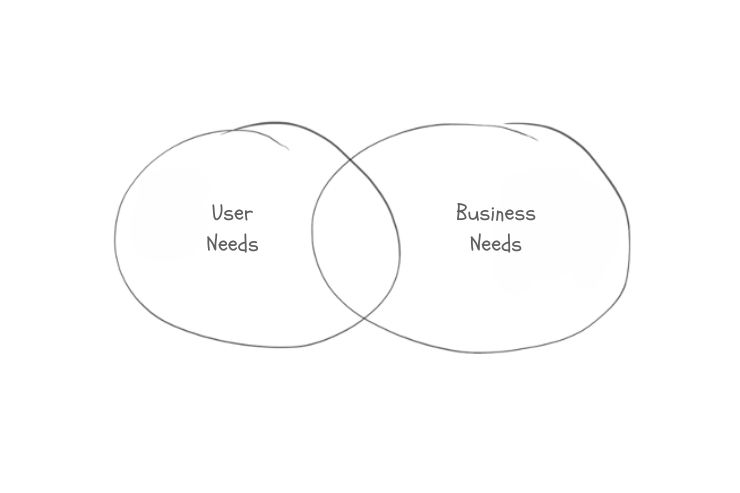
Many years ago, it was said that UX is what creates value at the intersection of user needs and business needs. The clarity of this statement is still striking today. And I believe that right now, in early 2024, this idea can help us make sense of current developments.
My belief: UX will become clearer! When we reflect on this, we’ll stop doing certain things that we’ve considered part of our work in recent years. We’ll focus more intensely on other things. And it’ll be good.
Most UX professionals are familiar with the Venn diagram showing user needs and business needs. And hooray, the intersection is UX! This has always come with a promise: UX creates value and bridges different worlds:
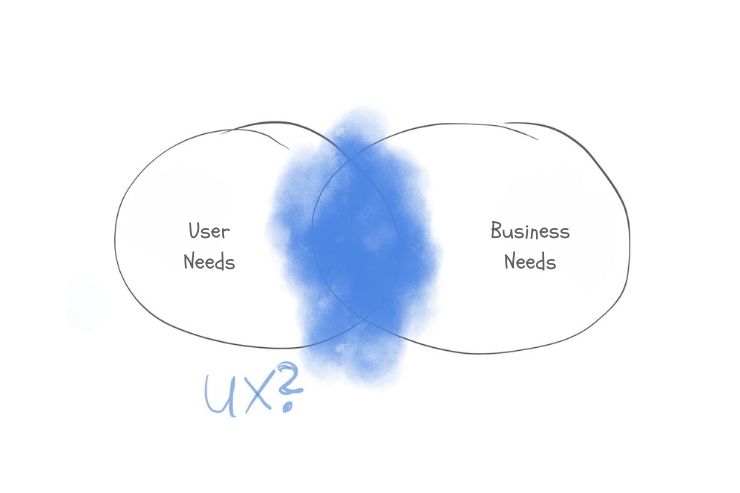
In the real world of work, things look different. What we do falls somewhere in that area, but it’s getting out of hand:
Now is the chance to deliver on that promise. 2024 could be the beginning. To cut out the non-UX elements, to weed them out:
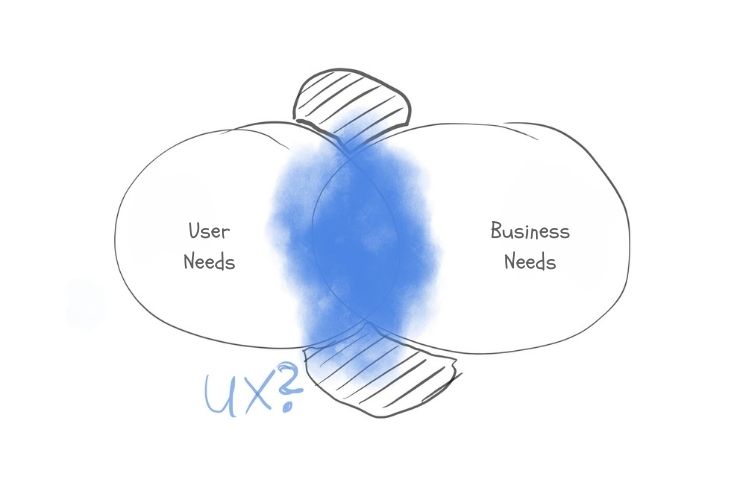
Hopefully, we’ll stop reinventing the wheel, the accordion pattern, or form semantics. That’s all been done. Working on these things benefits neither users nor the business: it’s not UX!
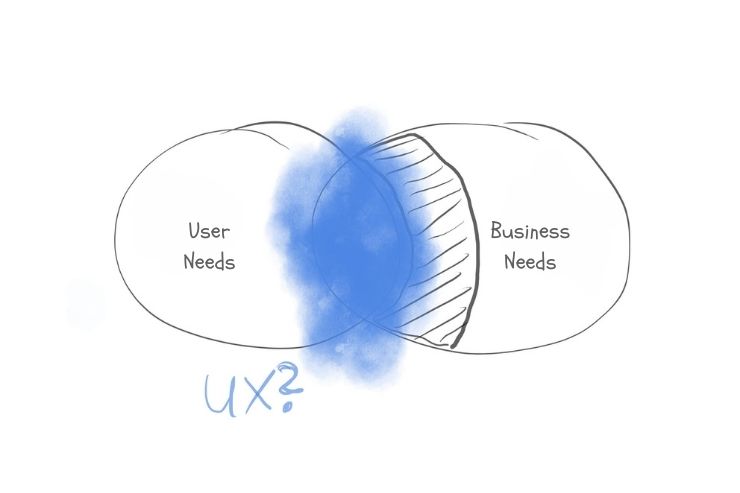
What can be phased out: Take conversion optimization, for example: AI is better at using dark patterns and nitpicky optimizations than humans ever could be. And it doesn’t align with what UX should be anyway, because it doesn’t take users seriously.
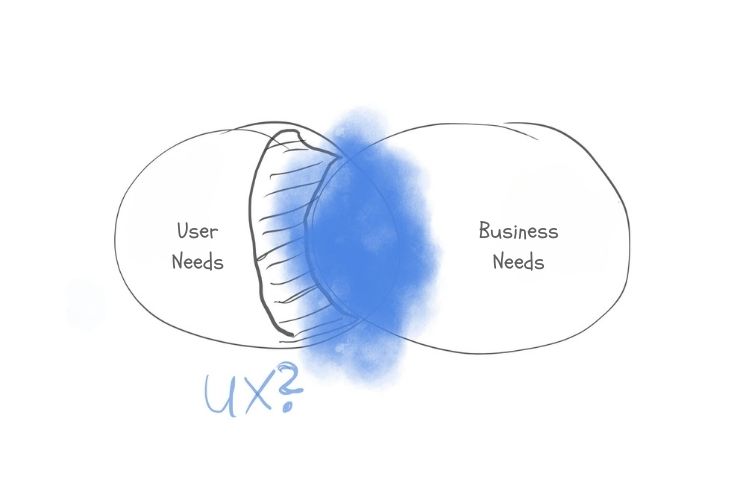
We can no longer afford to do things in a vacuum and ignore the business side of things.
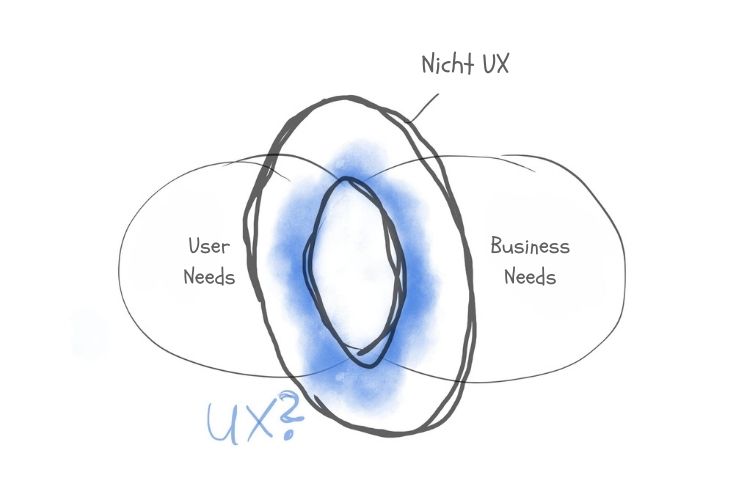
That means a whole lot of things are going away…
… and clarity emerges for our field:
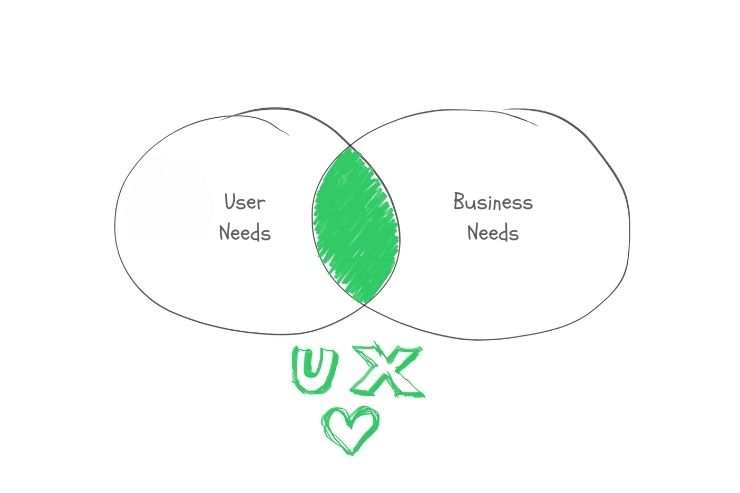
Gain deeper insight into user needs through research. Continue refining our methods. Better understand business needs. Take a fresh look at our expertise. These are the promises we’ve made to ourselves. To achieve this, we must strive to strengthen clarity and continually refine it. If we do this right, it will create a mutually reinforcing cycle. And only then is it truly UX.
AI support for user research and data analysis
Trend by Thomas Göthe, senior UX consultant
One development that no UX professional can ignore is AI. ChatGPT and other AI-powered tools will increasingly find their way into the workflows of UX professionals, and thus into our toolkits. In 2024 and beyond, AI-powered UX design will continue to advance. AI tools will be used to support and structure research. These tools won’t just be used for evaluating and processing results. Even in the early stages, when first diving into a topic, large language models like ChatGPT can provide access to broad domain knowledge and offer initial approaches to research questions.
Potential applications of AI in UX research:
- Create research questions
- Draw on the extensive dataset and create initial user journeys
- Drawing on specialized domain expertise
- Creating proto-personas
- Creating interview guides
- Conduct behavioral analytics, e.g., using tools like Hotjar
- Use sentiment analytics to associate emotions with user opinions, e.g., with MonkeyLearn
But beware of AI hallucinations! AI predictions are based on the collected and trained datasets and should always be reviewed, questioned, and validated through real research. Whether the direction or idea suggested by the AI is the right one can only be validated through real user testing. People will therefore remain irreplaceable in a human-centered design process well into the future.
What can you do to familiarize yourself with the subject? Don’t be afraid. Try out tools like ChatGPT, Midjourney, and Dall-E, and start conducting your own small experiments. You should get a feel for how to formulate prompts to generate meaningful output. Additionally, you can use your own UX skills to talk to people who are already using or have used AI to gain a better understanding. Podcasts on the topic are also recommended, such as Episode 24 of “The NN/g UX Podcast,” which explicitly addresses the use of AI in UX and also discusses the risks involved.
AI will soon become an indispensable part of the work environment for UX professionals, given its proven potential to boost productivity in our field (see “The Impact of AI on Developer Productivity: Evidence from GitHub Copilot”).
Team alignment using WOOP at the start of product discovery
Trend by Thomas Petzold, senior UX consultant
In 2024, it will become even more crucial for product teams to identify and define shared goals and strategies. The key questions are: Where do we stand right now? What goals are we pursuing? And above all, how do we achieve these goals? Involving all relevant team members early on ensures a diverse range of perspectives and fosters a shared understanding of Wish, Outcome, Obstacles, and Plan (WOOP).
- Wish: The first step involves clearly identifying and articulating the wish or goal. In the context of UX projects, this could be, for example, the pursuit of an improved user experience or the introduction of innovative design elements.
- Outcome: This involves visualizing the positive result that comes from fulfilling a desire. In the field of UX, this could be imagining how usability is improved and how users respond positively to the new features.
- Obstacle: It’s important to identify potential obstacles or barriers that could hinder the fulfillment of the goal. These can include technological, time-related, or even interpersonal challenges, which should be recognized and discussed during team alignment sessions.
It’s important that, during the alignment process, team members not only interact on a professional level but also get to know each other personally and communicate openly about ideas, challenges, and potential successes. This also strengthens teamwork, which not only boosts efficiency but also leads to innovative solutions.
The path to successful UX projects in 2024 thus begins with open communication, shared alignment, and a clear understanding of common goals and challenges.
Focus
Trend by Juliana Hirsing, senior UX writer
One core UX task will shine in 2024: helping people focus on what matters most and navigate the digital world with minimal mental clutter. We all need focus for our physical health and productivity. An information overload, countless communication channels, complex global interconnections, and personal challenges are increasingly getting in the way. UX has enormous potential to make a difference here. Minimalist design, clear navigation, appropriate depth of information, and standards should take precedence over eye candy and originality in 2024 more than ever. (Take the cookie notice, for example: It once seemed like a nice idea to add a bit of humor and variety here. But how nice would it be to finally have a visual and functional standard?)
As a copywriter, I’ll be asking myself even more often this year: Do we really need this? What is the essence of a flow, both linguistically and conceptually? Clarity, brevity, and precision are the criteria. It will be exciting to design digital products in a “conversational” way, so that users are guided with empathy and can develop an emotional connection to the brand or product. In line with this, I also want to streamline my own processes, reduce the number of tools I use, and leverage AI for certain tasks so I can focus on the value-adding work.
Interactive data visualization
Trend by Manuel Stieglitz-Hartmann, senior UX consultant
“A picture is worth a thousand words,” and this also applies to the user experience, which is why in 2024, effective interactive data visualization can make the difference between a good experience and a great one. Visual presentation can convey information more quickly, easily, and clearly. These are all criteria that can aid in the design of interfaces. And when combined with interactivity, users can truly explore data.
Interactive data visualizations are valuable tools in fields such as data analysis, business intelligence, scientific research, and journalism. They enable users to gain insights, discover patterns, and make data-driven decisions by actively interacting with the visual representation of information.
Among the most important features are:
1. User engagement: Users can interact with the visualization and explore different aspects of the data based on their interests or questions.
2. Dynamic exploration: The ability to change parameters, zoom in or out, filter data, or switch between different views allows users to dynamically explore patterns, trends, and details within the dataset.
3. Real-time updates: Interactive visualizations often provide real-time updates or immediate responses to user actions to enable a responsive and seamless user experience.
4. Customization: Users can customize the visualization settings, such as adjusting axes, selecting specific data points, or choosing different visual representations, to suit their preferences and analysis needs.
5. Multidimensional views: Interactive data visualizations can present data across multiple dimensions, allowing users to explore complex relationships and dependencies within the dataset.
6. Tooltips and information displays: Providing additional contextual information or details via tooltips and information displays improves user understanding and helps users make informed interpretations.
A very well-known and, at the same time, long-standing example is the 1869 visualization of Napoleon’s Russian campaign. In it, six variables are represented in just two dimensions:
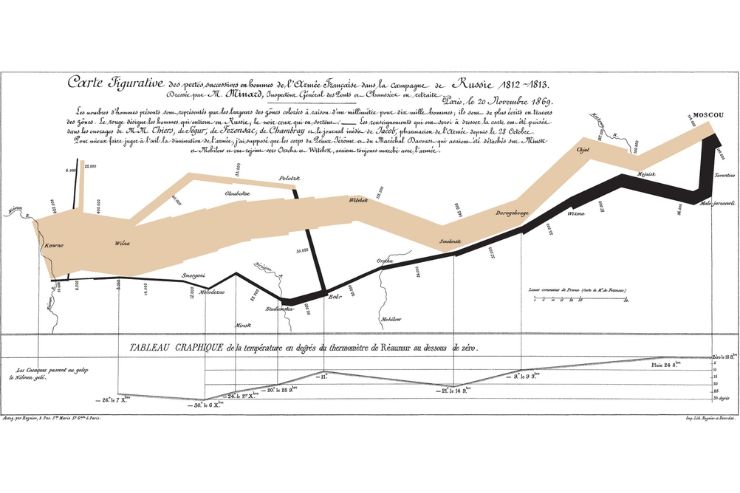
For examples of current data visualizations from a wide variety of fields, the website “Information Is Beautiful” is a great place to start. For anyone who’d also like to take a look behind the scenes, I recommend the work of Mike Bostock, who pioneered D3, a very powerful JavaScript library for data visualization. The D3 sample page features over 100 visualizations that demonstrate both interaction possibilities and visualization techniques, such as those used to present hierarchical relationships between classes in software. I also found the interactive map from Radlquartier München to be particularly well done.
We stand on the shoulders of giants: All these examples illustrate just how diverse and powerful data visualizations can be, and that it’s always worth researching what others have already done.
Before we enhance our user interfaces with interactive data visualizations, we should always consider dark patterns. In data visualization, these refer to deliberate design choices and ways of presenting information that manipulate or deceive users and influence their perceptions, behavior, or decision-making in ways that may not be in the users’ best interest. Here are a few examples:
1. Misleading axes: Manipulating the scale of the axes to exaggerate or minimize differences in the data. This can make small changes appear significant, or vice versa.
2. Data cherry-picking: Selectively presenting data points or time periods to highlight a specific trend while ignoring other relevant information that could provide a more accurate picture.
3. Biased color schemes: Using colors in a way that influences perception, such as selecting colors associated with positive or negative emotions, or using color gradients that misrepresent the data.
4. Inconsistent units or scales: Presenting different units or scales in the same visualization, which makes it difficult for users to compare data points accurately.
5. Information overlay: Placing unrelated or misleading graphics over the data to distract users from the actual information or to convey a false narrative.
6. Manipulation of data labels: Selective use of labels to emphasize or downplay certain data points, or the strategic placement of labels to divert attention from important details.
7. Missing or omitted context: The absence of necessary contextual information or the omission of details that would help users interpret the data accurately, leading to misunderstandings.
8. Distracting data animations: Adding unnecessary animations or visual effects that divert attention from important data points or trends.
This brief introduction is intended to show what interactive data visualizations make possible and what needs to be considered from the user’s perspective. They are a powerful addition to a user interface, but they also have a significant impact on the user experience, which is why a solid foundation in data visualization is the ideal complement for every UX professional in 2024.
Conclusion
2024 will be an exciting year for the UX world. The focus will be on increasing clarity, fostering team alignment, and concentrating on what matters most to guide users safely and without distraction through the digital landscape. Interactive data visualizations will also play an even more important role. In doing so, we must always consider ethical aspects and value people in our design process. Let’s embark on a year full of innovations and creative solutions that add value and put people at the center.
About the experts
Tobias co-founded UX&I. He is dedicated to empowering people. His areas of focus also include organizational culture and structure.